Evergage Platform Redesign
2018
I began working at Evergage in August 2014 and over the past 4 years the platform and user base drastically evolved due to the change in the market. A lot of my work over this time helped the team understand the users, define user problems and direct the solutions; including this Evergage platform redesign.
Project Description
This platform redesign is a complex and very impactful project that I’ve broken into three cohesive stories. This is the first one that explains how I helped define the problem and users, the second and third ones walk through how I helped design the two solutions - campaign list redesign and navigation redesign.
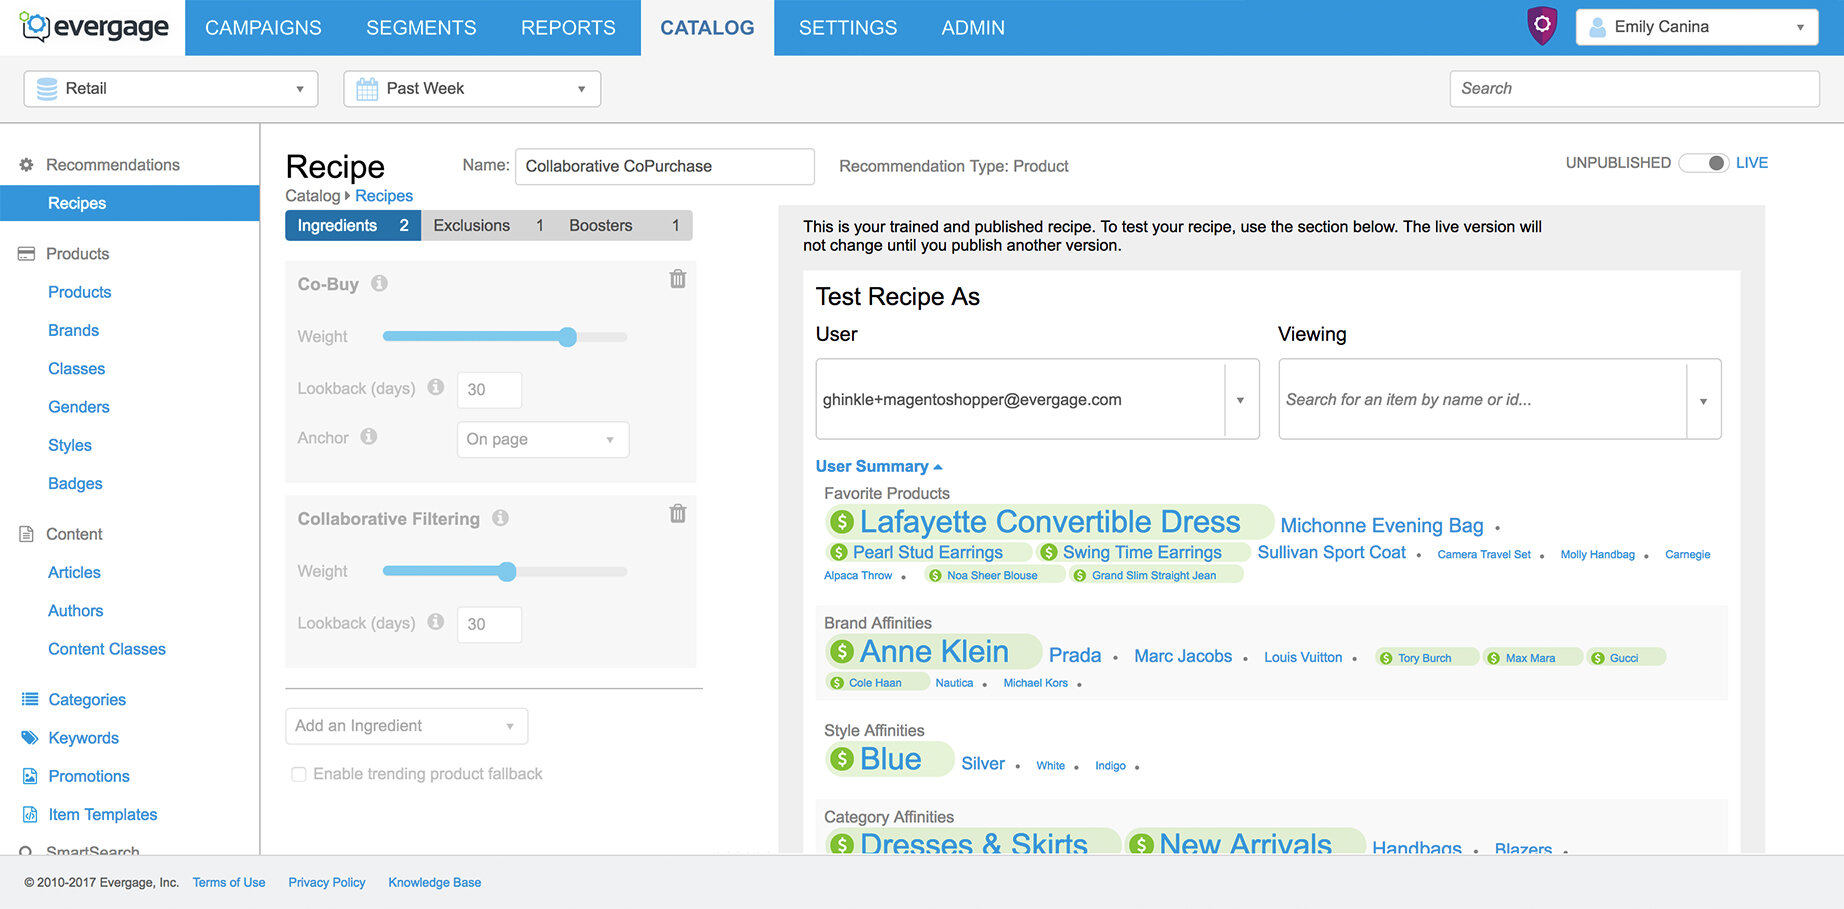
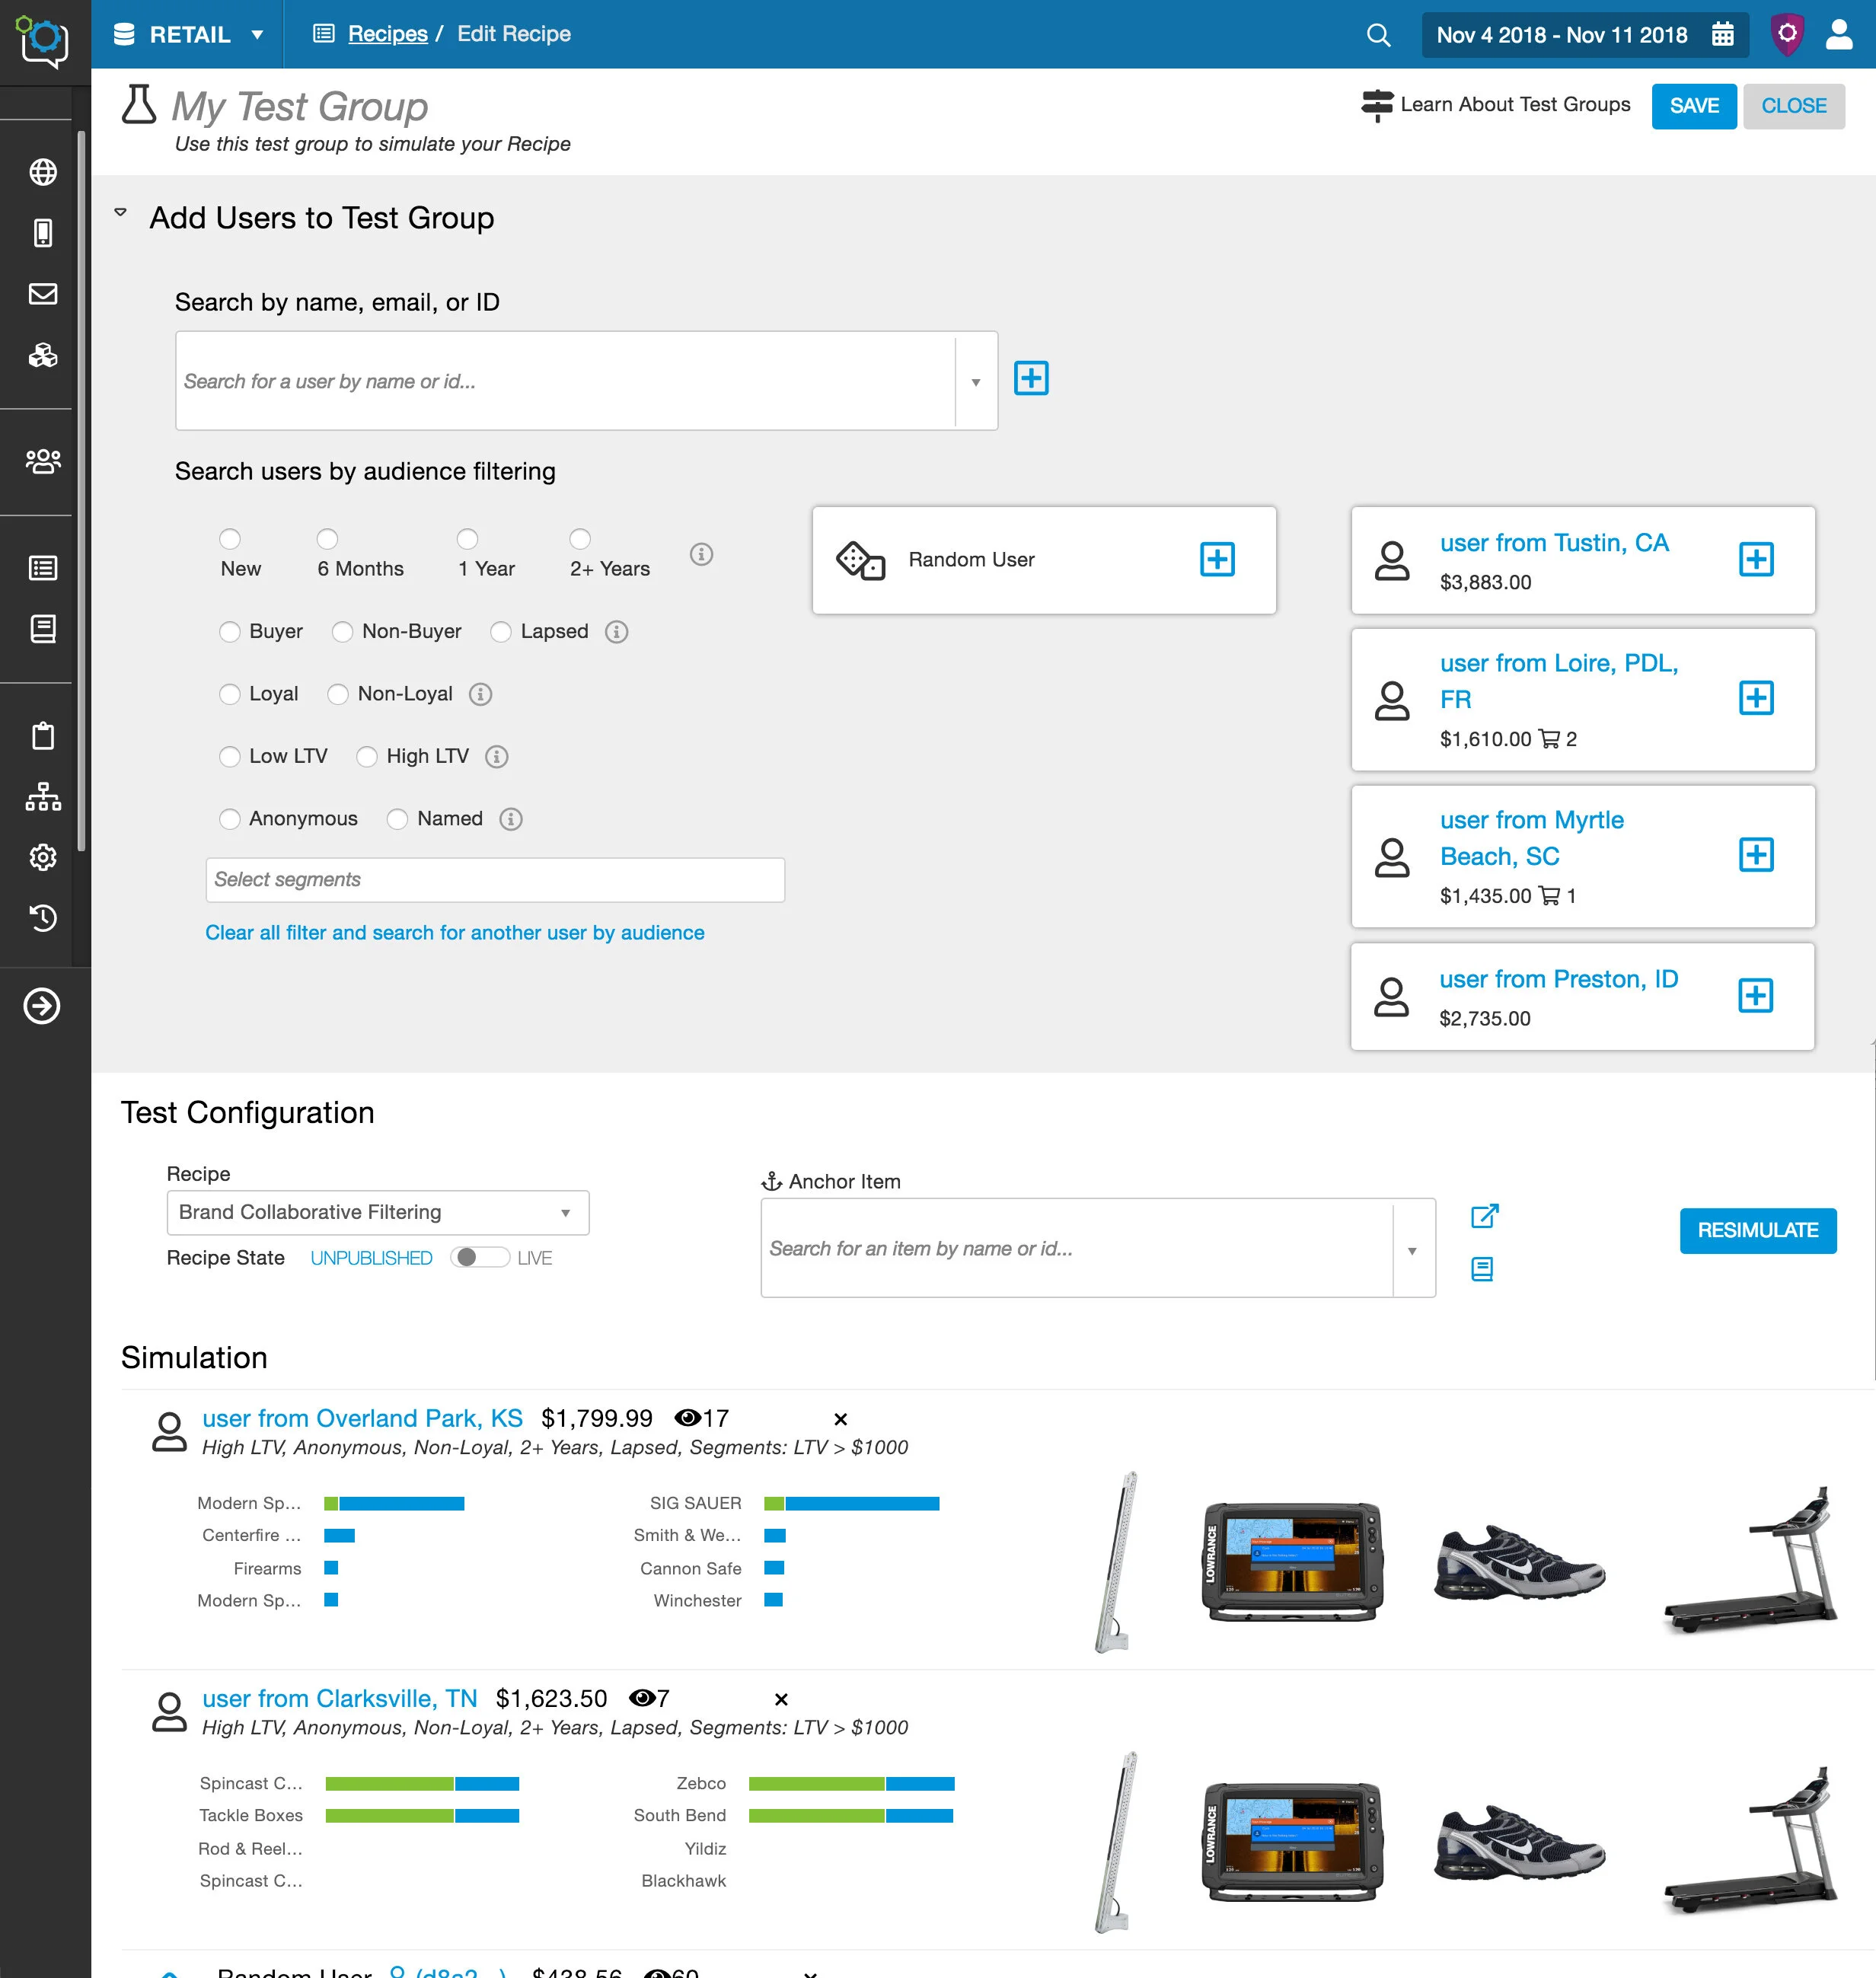
What is Evergage?
A cloud based B2B personalization and customer data platform that provides companies with business solutions using machine learning to increase revenue and customer loyalty. The data can be used to target the right users for a 1-1 personalized experience across channels - web, mobile, email, and third parties.
The Problem
Feature creep and rapid growth created a convoluted UI that was negatively effecting the usability. In addition, the platform and features were inefficient because there were 7 “jobs to be done” personas using the platform and the UI was not optimized for their individual goals and tasks. These issues caused clients to churn and prospects to move to competitors.
The User and Platform in 2014 vs 2018


The Team
Included the UX Director, the CTO, myself and 20 engineers. Our CTO and company was very feature focused. , We mainly focused on business problems and feature instead of focusing on user problems.
My Role - UX design, user research, understanding the user, the problem, and defining the solution, visual design, interactive design. I took on the responsibility to oversee the user research, how we collect data, and collaborate with the other teams to get feedback. As the team’s primary user advocate, I helped the team define the target users, identify the user problems, and define and design successful solutions.
The Story
This story will outline in three steps how the team and I defined the users, defined the problems, and determined and action plan for the solution.
1. Defined the Users
I identified our users, the teams, and companies. As a B2B company it was critical to understand those three levels. To gather this data I collaborated with other departments and teams and used other data collecting resources.
How I Collected the Information
Evergage Product Personas
To define the users I collaborated with the Customer Success team and CTO to create 7 Evergage product personas.

Ongoing User Feedback
I kept a strong relationship with the other departments and was informed of their user feedback and pain points. By means of periodically attending CS and Support team meetings, hallway talk, support tickets, and scheduled interviews about specific accounts and users.
User, Team, and Company Profiles
I created these profiles to document the important information such as goals, measure of success, org structure, responsibilities, cross channel interaction, how well the company trusted our data, and more. I collected the information from previous user tests, my ongoing user feedback, Salesforce, and Evergage on Evergage.

The Users
Users - A diverse set of types and roles that fit into a roughly 7 “jobs to be done” personas. There were 4-5 personas that each company needed to fully utilize the basic platform and 2 that were feature specific.
Basic Platform Personas
Technical campaign builder and strategic campaign builder (Campaign Implementation)
Manager to drive personalization strategy
Analyst
Executive
Feature Specific Personas
Email Marketer - For the companies that used our email campaigns.
Merchandiser - For companies that used Evergage to manage and optimize their inventory
The goals of the strategic persona goals were closer if not the same as their company business goals whereas the goals of the implementation persona were not.
Teams - Personalization teams, web teams, mobile teams, email teams, and Evergage teams. Each team ranged in level of organization, sophistication, function, and collaboration across teams and departments.
Companies - Mid - enterprise companies across industries including retail, financial services, technology, sporting goods, fashion, and gaming. They fell into trow main buckets, users that collected revenue data and those that didn’t. Most companies had the same high level business goals of increasing loyalty, conversion, and revenue, but there were key differences in how the companies were run that effected the product usage and adoption including maturity level, strategy, the importance of personalization, organization, and product adoption.
Take aways
Certain features and areas of the platform, like the campaign list screens was used by multiple personas
We need to especially account for the persona goals that aren’t tied to the business goals
The platform needs to be more collaborative and flexible
2. Defined the Problems
The CTO took on most of the Product Manager responsibilities and did market and competitive research, joined important client calls, and constantly talked to other departments and clients. We used our findings and knowledge to define the user and business problems.
User problems
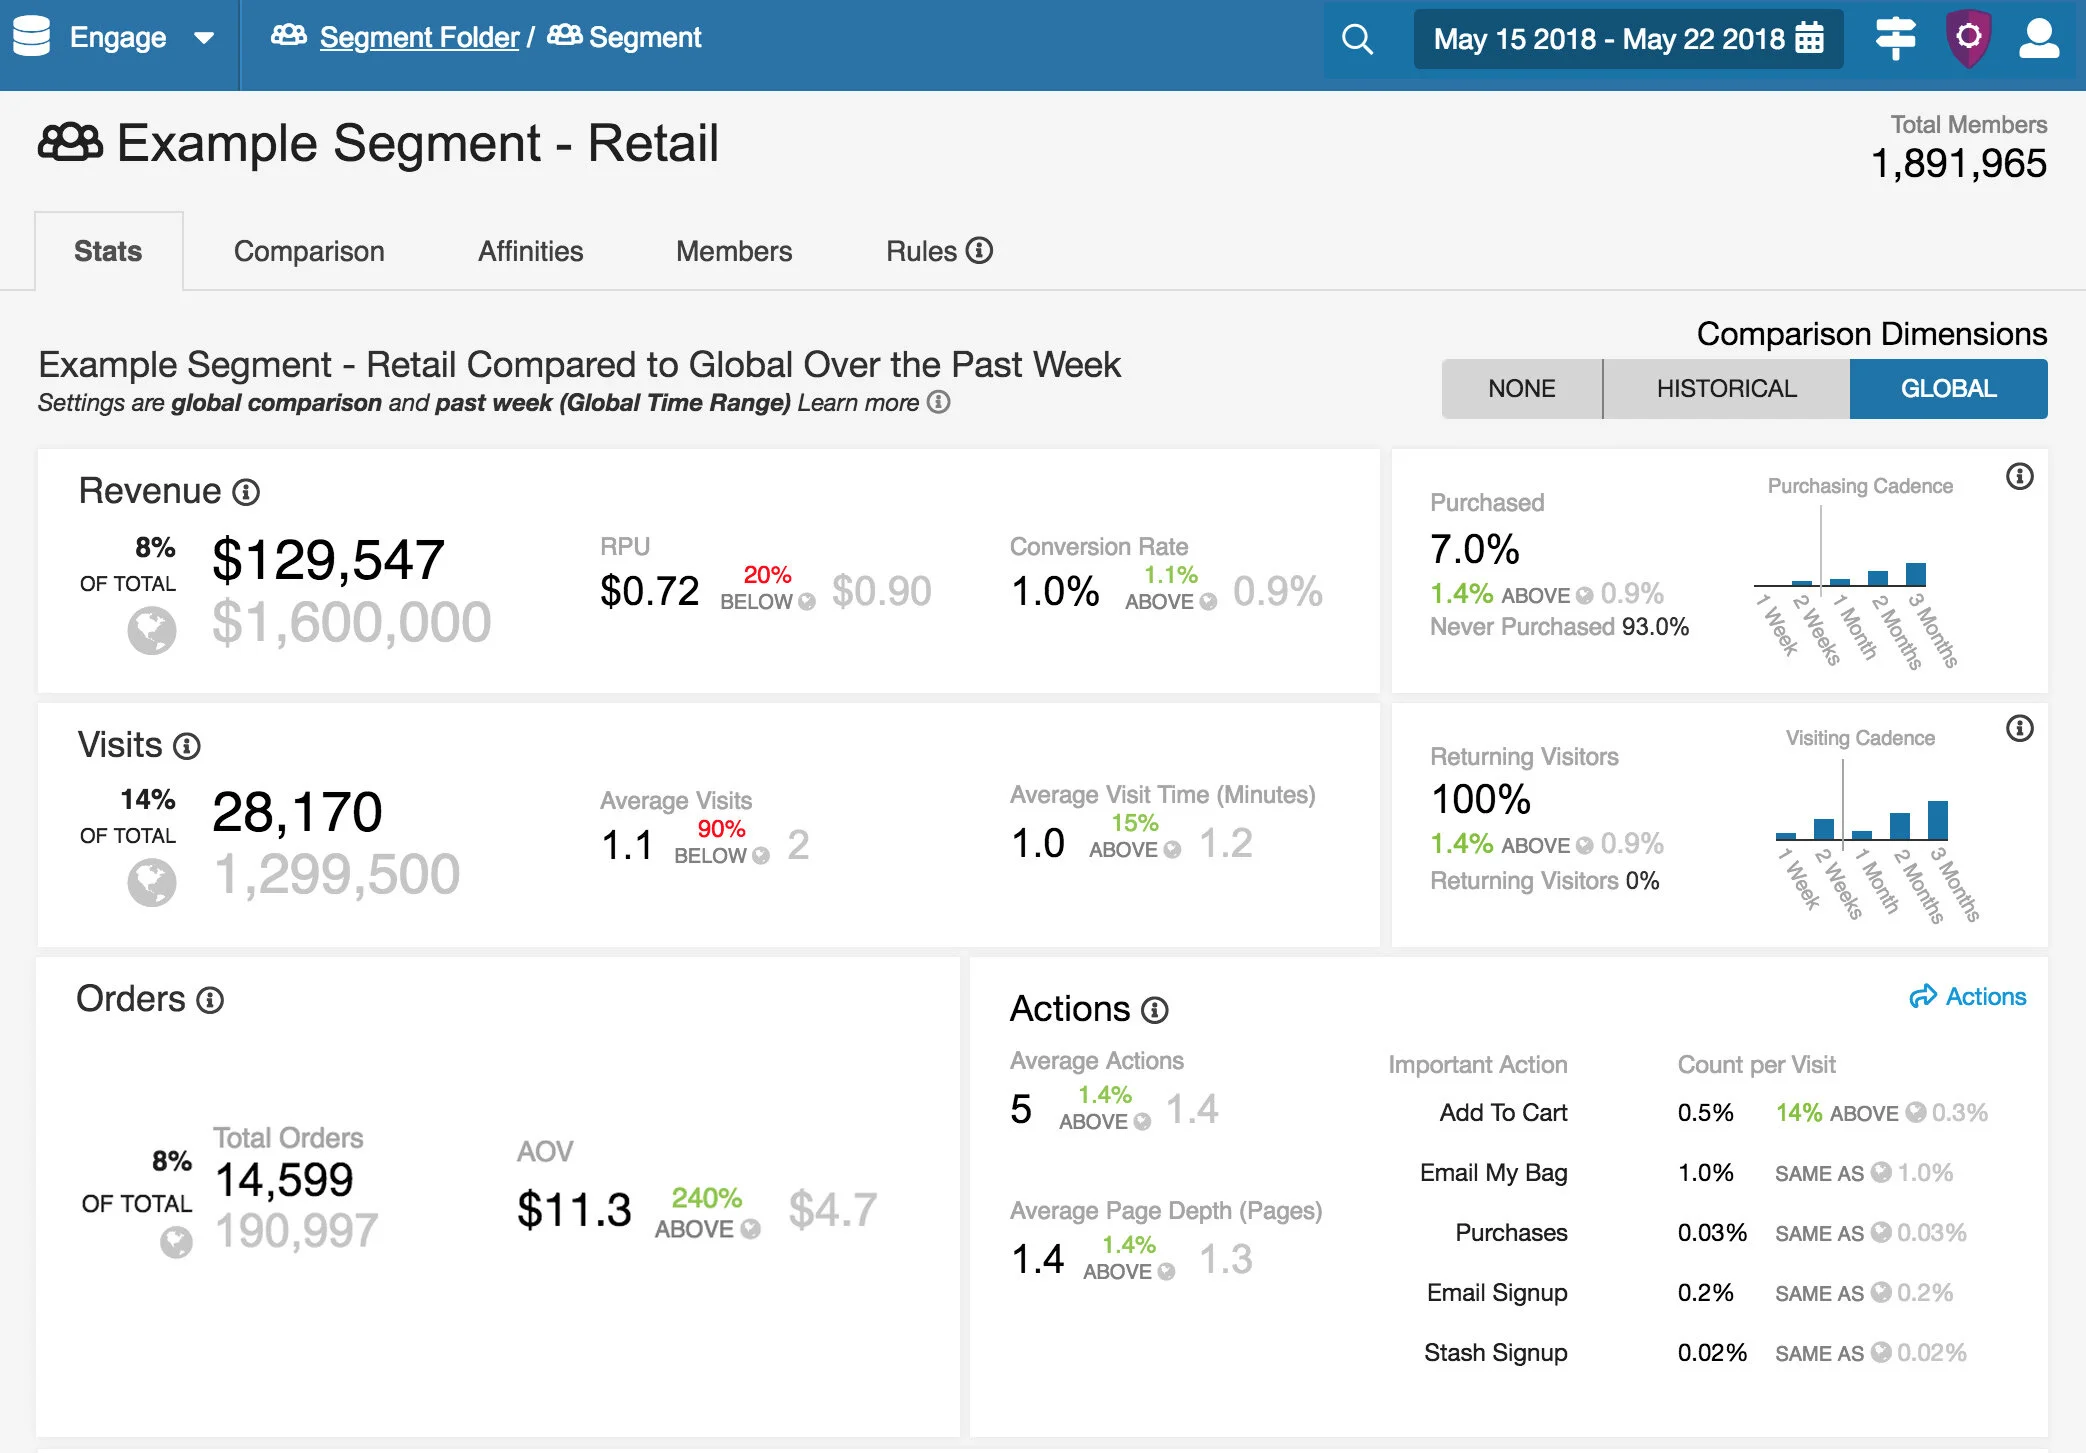
Analysts and strategic personas had trouble finding critical data and reports about their business, products, and users.
Analysts and strategic personas spent hours each day collecting campaign data.
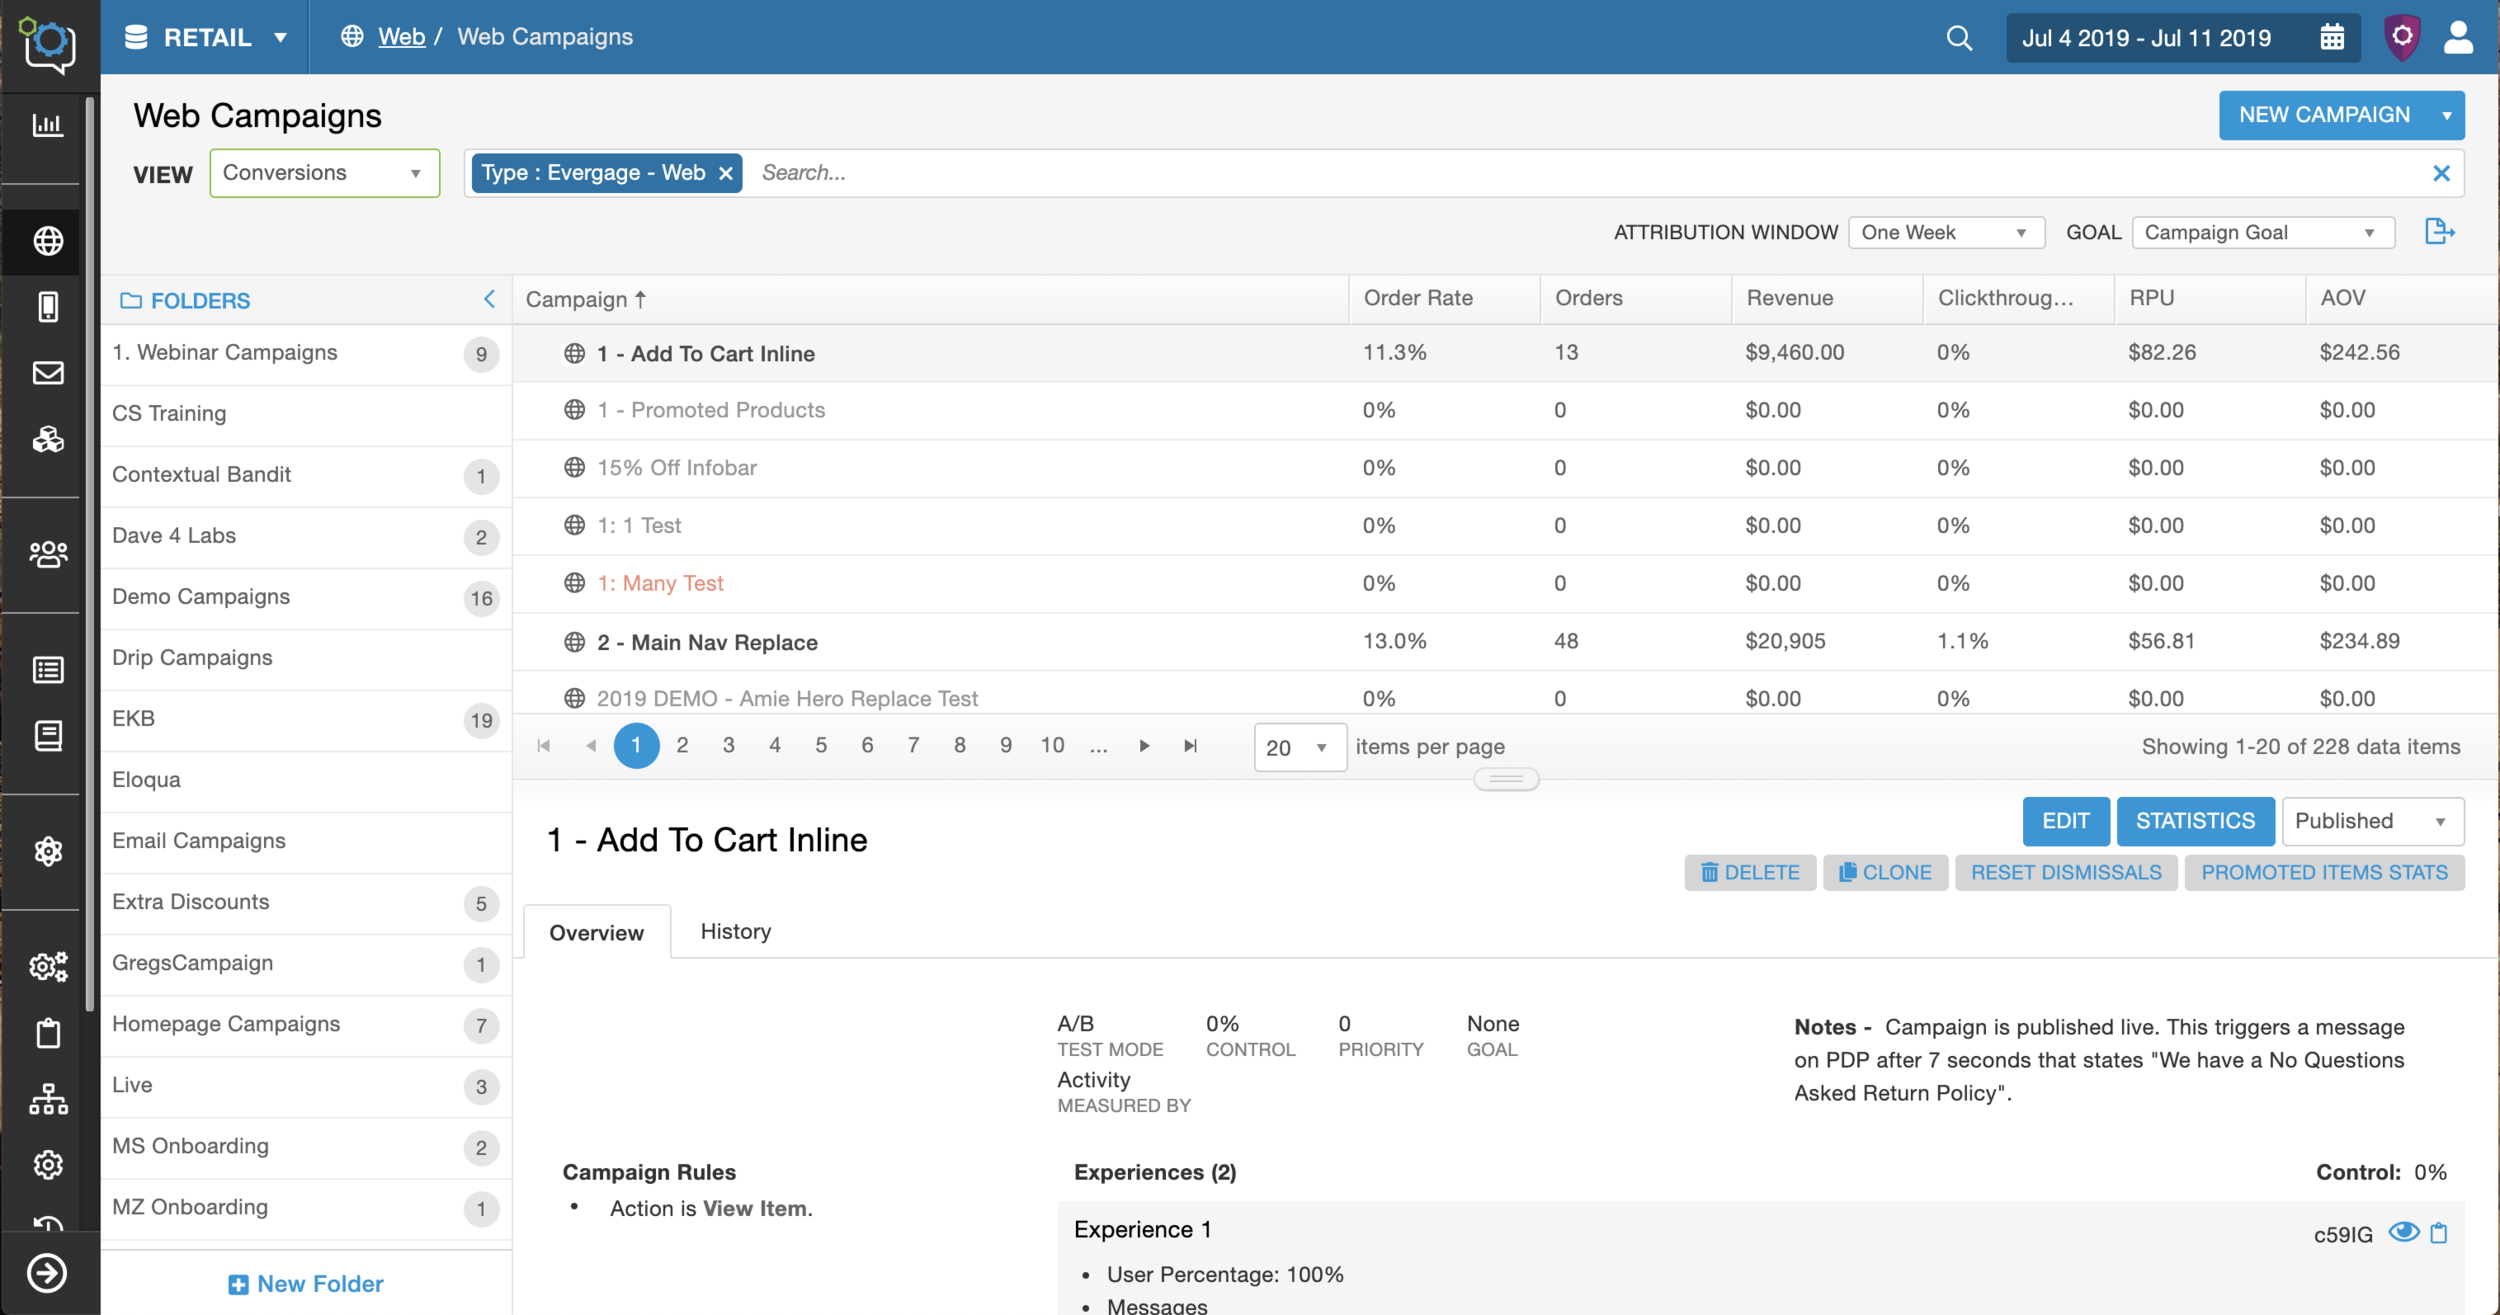
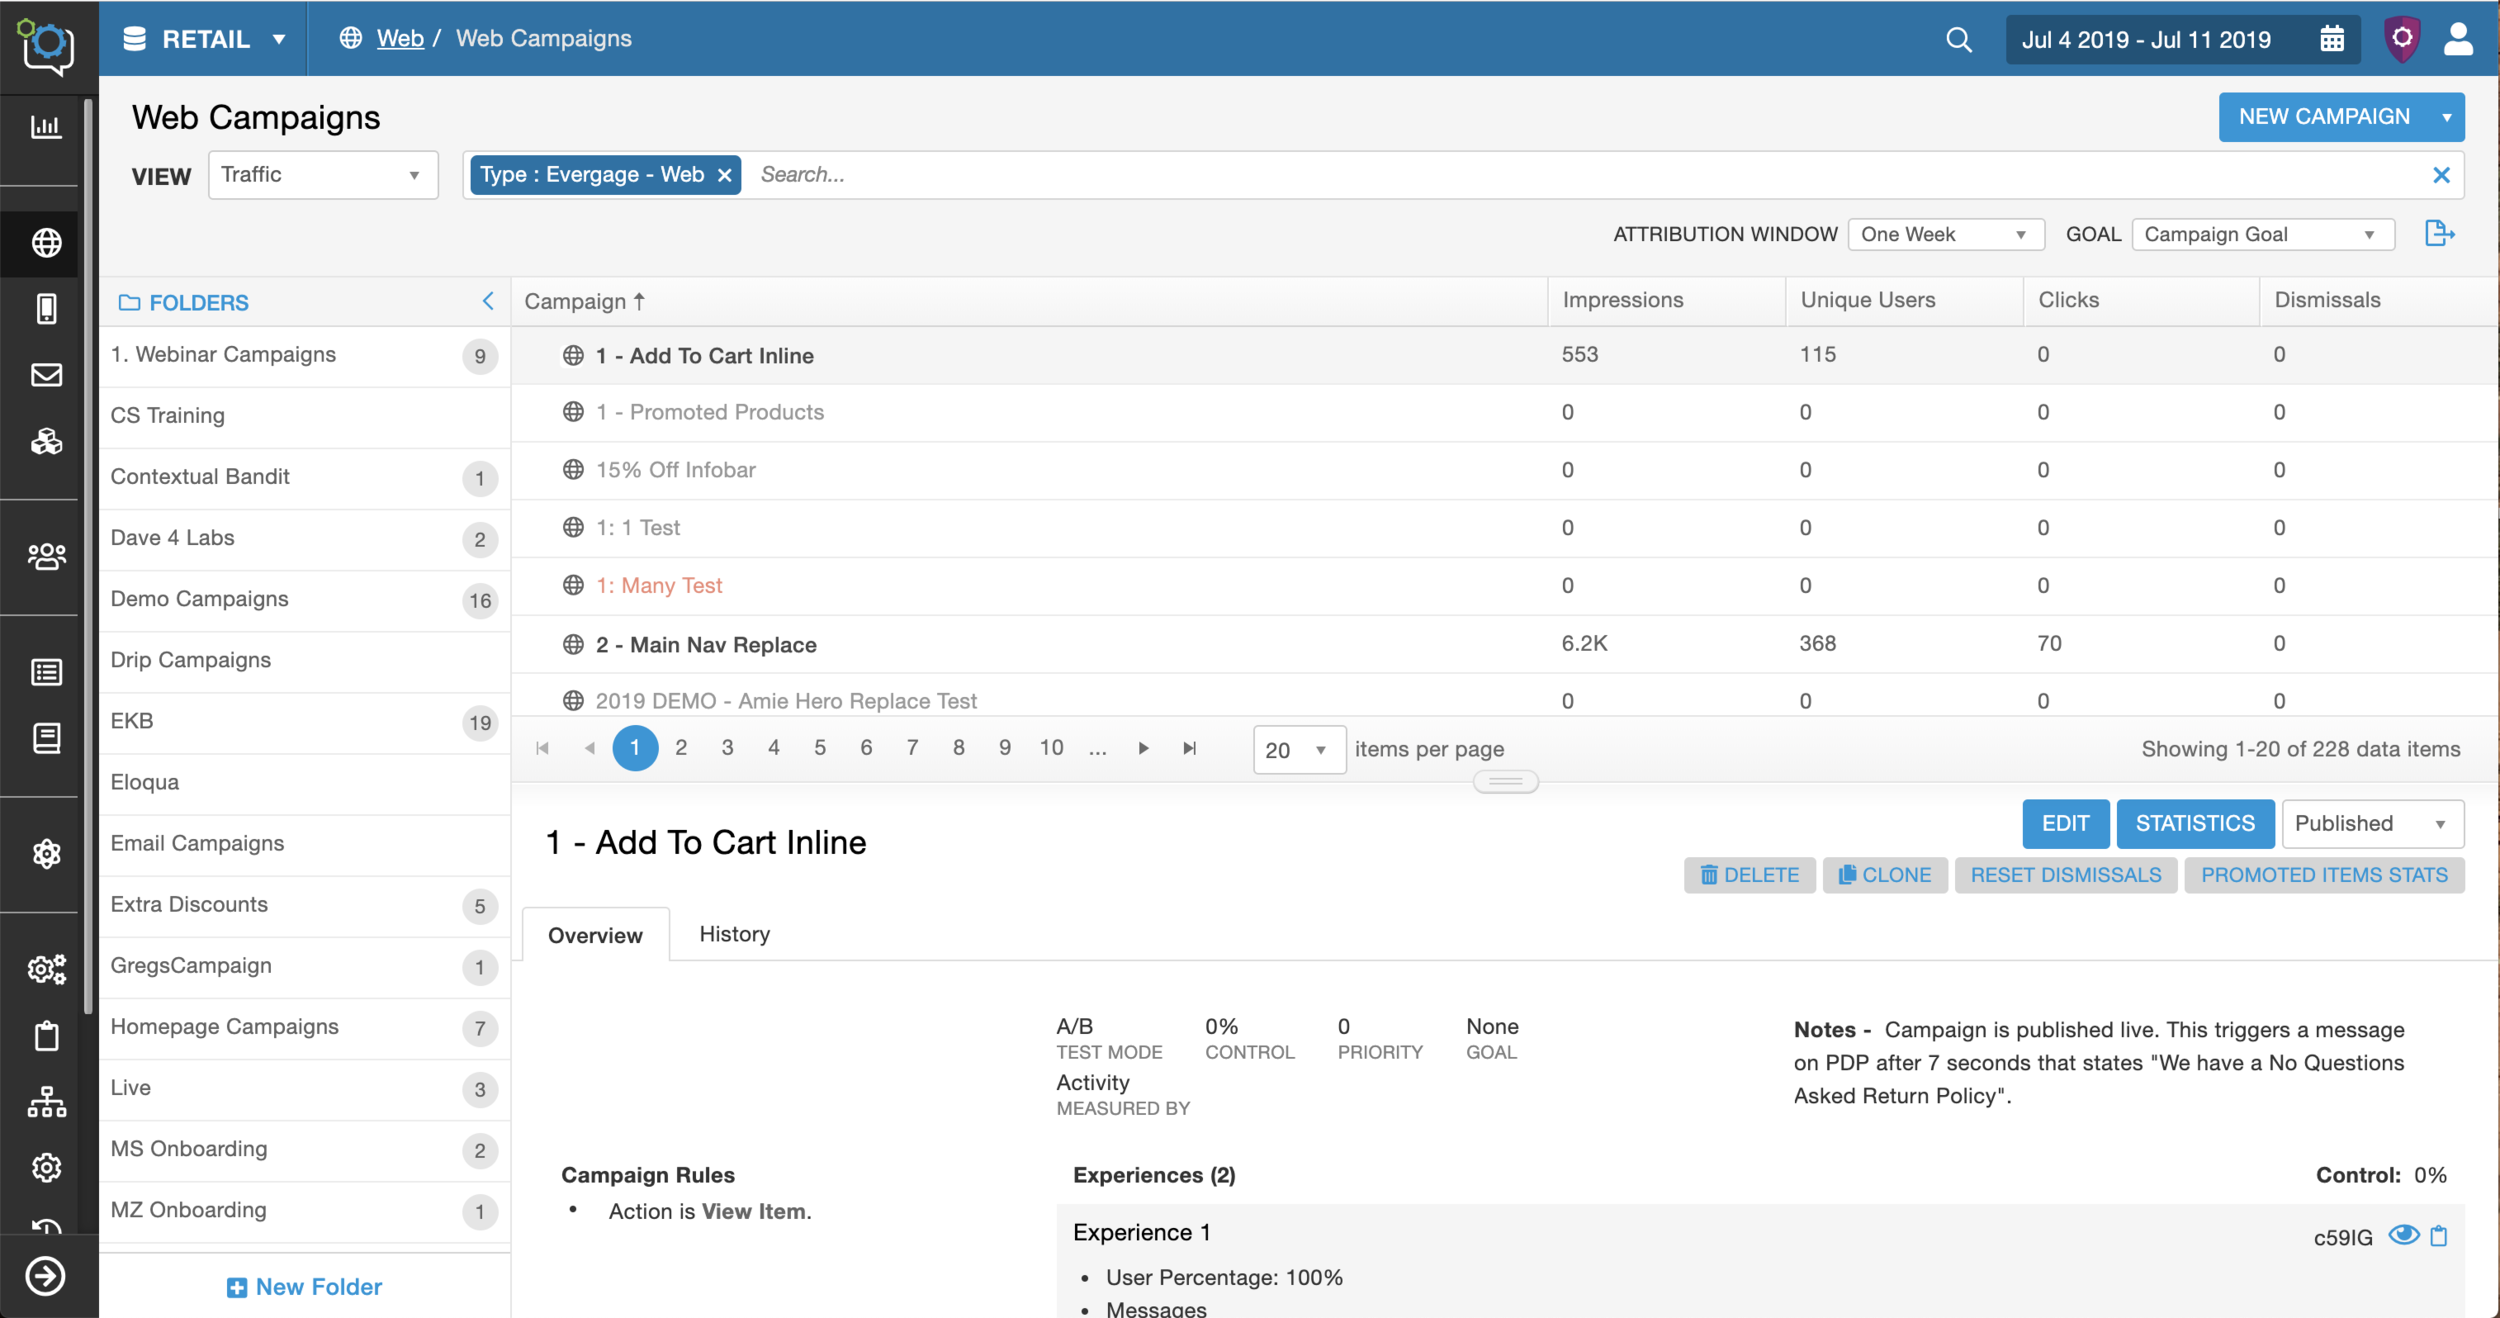
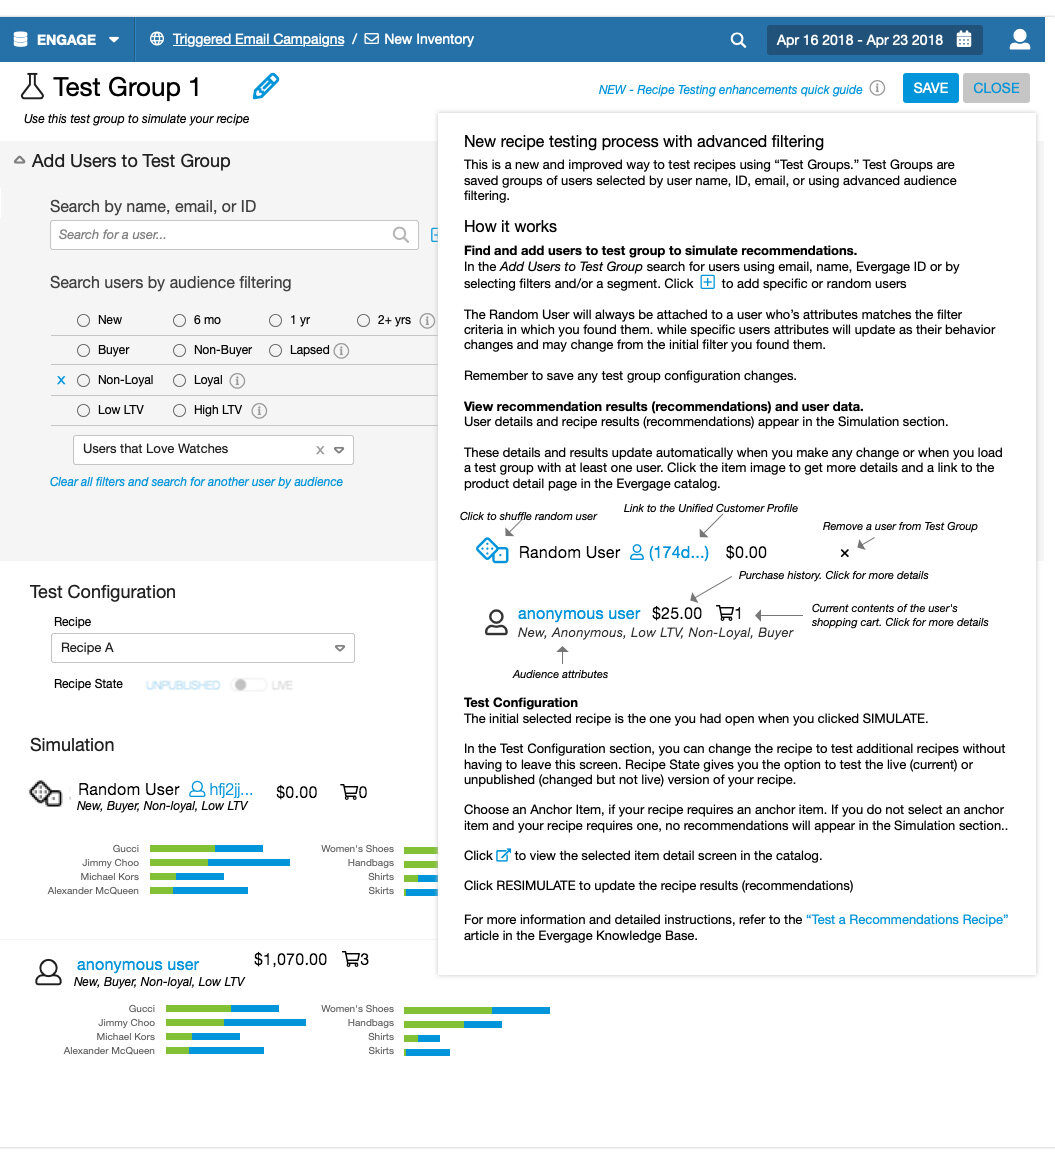
To get the data for each campaign clients were tediously clicking one level further into each campaign to the campaign stats.
Managers had difficulty organizing and managing their campaigns.
Campaign implementation personas spent extra time finding campaign details.
Everyone had difficulty finding pertinent features.
Strategic and implementation personas spent extra time finding campaigns, especially across channels.
Business problems
The CS team had trouble with client engagement and on-boarding and the Sales team had difficulty selling the power of the platform because of the following:
The platform was very busy and overwhelming for clients and prospects.
The platform didn’t tell a cohesive story.
Prospects didn’t trust the power because the UI in their opinion was outdated.
3. Determined an Action Plan for the Solution
We were still moving at a rapid pace and needed to address the problems as quickly as possible. The feedback was targeted at the most impactful areas of the platform - the navigation and the campaign list screen. The problems were turned into goals and broken into two large projects to focus on those two areas. Click on the project header to read the stories. (password: bVKevZ@9b8)
Navigation Redesign
The navigation was five sections and it was clear that the structure was no longer effective for our current and future users and product growth.
Project Goals
Reorganize the navigation and platform
Expose important data and reports
Make it easier to find pertinent features and functionality
Solve the problems in a way that works for each persona
Improve the styles
My Impact - This was a collaboration with the UX Director. I applied my knowledge of the user, business, and platform, intuition, and design thinking to improve the information architecture, while she focused on the styles.
Campaign List Redesign
Campaigns are the solutions that our clients implement to optimize their business. The campaign list screen is one of the most impactful screens because it is the central location that holds the information for all the campaigns, including status and revenue data.
Project Goals
Add better support for campaign organization
Expose campaign data
Make it easier to find campaigns
Make it easier to find campaign details
Solve the problems in a way that works for each persona
Improve the styles
My Impact - I was the design lead and had the autonomy to structure the project involve the user in each step of the process to design a more user centered platform.
Retrospective
Overall the project went well and was very impactful for the users, product growth, and company.
Impact
Resulted in signing numerous high revenue and high opportunity clients.
Increased client renewal rate of target clients about 70%.
The UI helped the Sales and CS team tell a better product story resulting in increased sales and client retention.
Product team successfully added new features after the release.
An influx of positive client feedback and reported better ease of use.
Completed my personal initiative of successfully involving the user throughout the whole process.
What Would I Do Next Time
Spend more time on the problem definition. We just did a quick fix that did solve most of the problems, but if we took time to look at each problem, the platform holistically, and did more research we could have created a stronger platform.
Define the measure of success and measure the results.